質問 1:A large organization with more than 100 departments wants to raise money for a donation in the next 30 days This year, leadership decides to increase employee participation through a competition Team members of departments that raise $10,000 or more receive two additional holidays.
Leadership needs the following capabilities:
* Ability to view the total donation amount
* Ability to identify departments that raise S10,000 or more
Which two visualizations should the business analyst use without set analysis to meet these requirements?
(Select two.)
A. KPI
B. Bar chart
C. Treemap
D. Box plot
E. Pie chart
正解:A,B
質問 2: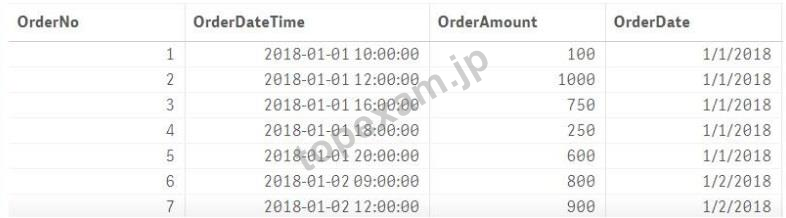
Refer to the exhibits
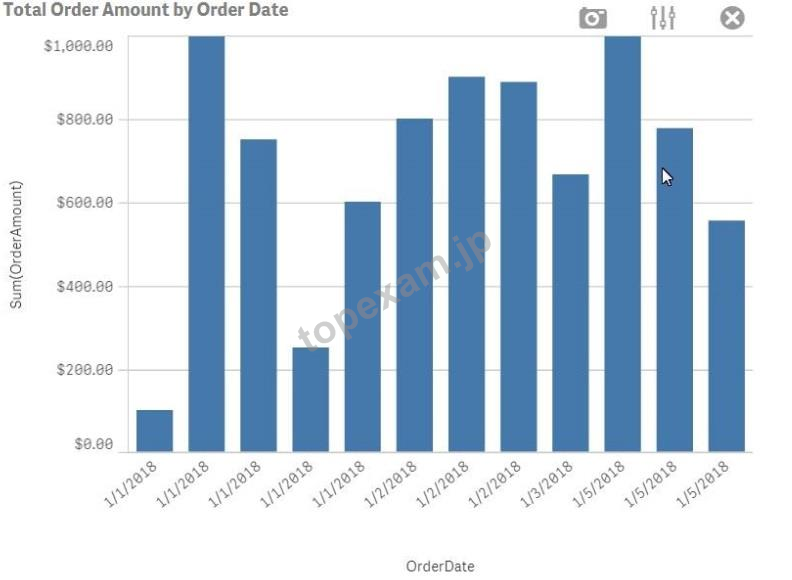
A business analyst must create a bar chart to show the total value of orders processed per day. The dataset loaded by the data architect only contains the OrderNo, OrderDateTime. and OrderAmount.
The business analyst creates a calculated field, OrderDate, using the expression, Date (OrderDateTime). The bar chart does NOT present the information correctly.
How should the business analyst fix this error?
A. Create a new calculated field for OrderDate with: Date (LTrim (OrderDateTime, 10))
B. Change the OrderDate number formatting to 'Date' in the properties panel
C. Change the OrderDate field type to "Date" with the format 'YYYY-MM-DD' in the data manager
D. Create a new calculated field for OrderDate with: Date (Floor (OrderDateTime))
正解:C
質問 3:Refer to the exhibit.
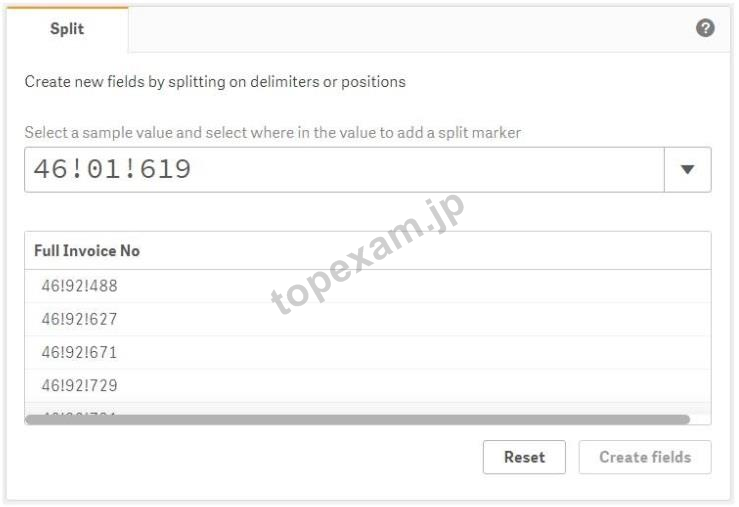
A business analyst must update an app by adding a new table called 'Invoices'. This table must be associated to the existing model via reference code values.
There is NO column available with reference codes in the Invoices table. This information can only be retrieved by splitting a field called 'Full Invoice No' from the Invoices table
'Full Invoice No' includes the 'CostCenter Code', the 'Department Code', and a 'Reference Code' The CostCenter Code is NOT relevant for further analysis, so the analyst must split this new field into two new columns.
Which set of actions should the business analyst take to meet these requirements?
A. * Select the split marker
* Click All instances
* Uncheck the first column
* Rename the fields
* Click Create fields
B. * Select the split marker
* Click This instance
* Uncheck the last two columns
* Rename the fields
* Click Reset
C. * Select the split marker
* Click All Instances
* Uncheck the last two columns
* Rename the fields
* Click Reset
D. * Select the split marker
* Click This instance
* Uncheck the first column
* Rename the fields
* Click Create fields
正解:B
質問 4:A business analyst has a QVD containing Sales, Manager. Date and Region The business analyst needs to quickly create a sheet with three visualizations Total Sales. Sales by Manager, and Sales by Date The sheet must allow for analysis by Region.
In the search bar, the analyst enters "Sales", "Manager", and "Date", and adds the objects to the sheet Which steps should the business analyst perform to finish creating the sheet?
A. 1 Add two filter panes: Date and Manager
2 Drag and drop Sales from the Fields list onto the sheet
3 Add a line chart with Manager as the dimension and Sales as the measure
B. 1 Add two filter panes Sales and Manager
2 Drag and drop Sales from the Fields list onto the sheet
3 Add a line chart with Date as the dimension and Sales as the measure
C. 1. Add two filter panes: Region and Sales
2 Drag and drop Manager from the Fields list onto the sheet
3 Add a line chart with Date as the dimension and Sales as the measure
D. 1. Add two filter panes: Region and Manager
2 Drag and drop Sales from the Fields list onto the sheet
3 Add a line chart with Date as the dimension and Sales as the measure
正解:C
質問 5: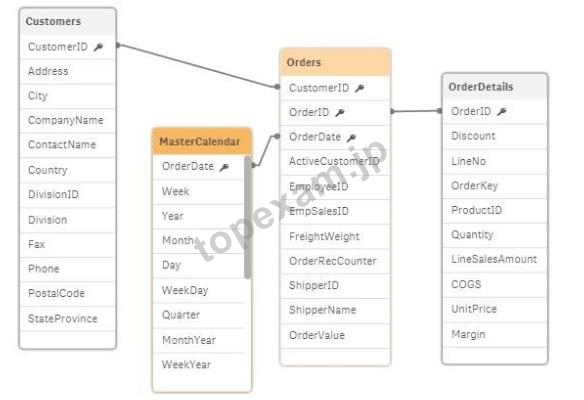
Refer to the exhibit.
A business analyst is testing an existing app that returns unexpected results.
Using the selection tool, the business analyst observes the following behavior
* Select a CompanyName and the associated OrderlD records are white
* Select a Year and all OrderlD records are gray
* Select an OrderlD and the Quarter values are all gray, but the CompanyNames are white
* Select a ProductID and the associated ShipperName and OrderDates are white, but the Year is gray What is causing these results?
A. MasterCalendar should be associated to the OrderDetails table
B. The logical model is NOT a star schema
C. OrderlD should be the key field in the MasterCalendar
D. The OrderDate fields are different data types
正解:C
弊社のQlik QSBA2018を利用すれば試験に合格できます
弊社のQlik QSBA2018は専門家たちが長年の経験を通して最新のシラバスに従って研究し出した勉強資料です。弊社はQSBA2018問題集の質問と答えが間違いないのを保証いたします。

この問題集は過去のデータから分析して作成されて、カバー率が高くて、受験者としてのあなたを助けて時間とお金を節約して試験に合格する通過率を高めます。我々の問題集は的中率が高くて、100%の合格率を保証します。我々の高質量のQlik QSBA2018を利用すれば、君は一回で試験に合格できます。
安全的な支払方式を利用しています
Credit Cardは今まで全世界の一番安全の支払方式です。少数の手続きの費用かかる必要がありますとはいえ、保障があります。お客様の利益を保障するために、弊社のQSBA2018問題集は全部Credit Cardで支払われることができます。
領収書について:社名入りの領収書が必要な場合、メールで社名に記入していただき送信してください。弊社はPDF版の領収書を提供いたします。
弊社は失敗したら全額で返金することを承諾します
我々は弊社のQSBA2018問題集に自信を持っていますから、試験に失敗したら返金する承諾をします。我々のQlik QSBA2018を利用して君は試験に合格できると信じています。もし試験に失敗したら、我々は君の支払ったお金を君に全額で返して、君の試験の失敗する経済損失を減少します。
一年間の無料更新サービスを提供します
君が弊社のQlik QSBA2018をご購入になってから、我々の承諾する一年間の更新サービスが無料で得られています。弊社の専門家たちは毎日更新状態を検査していますから、この一年間、更新されたら、弊社は更新されたQlik QSBA2018をお客様のメールアドレスにお送りいたします。だから、お客様はいつもタイムリーに更新の通知を受けることができます。我々は購入した一年間でお客様がずっと最新版のQlik QSBA2018を持っていることを保証します。
弊社は無料Qlik QSBA2018サンプルを提供します
お客様は問題集を購入する時、問題集の質量を心配するかもしれませんが、我々はこのことを解決するために、お客様に無料QSBA2018サンプルを提供いたします。そうすると、お客様は購入する前にサンプルをダウンロードしてやってみることができます。君はこのQSBA2018問題集は自分に適するかどうか判断して購入を決めることができます。
QSBA2018試験ツール:あなたの訓練に便利をもたらすために、あなたは自分のペースによって複数のパソコンで設置できます。
TopExamは君にQSBA2018の問題集を提供して、あなたの試験への復習にヘルプを提供して、君に難しい専門知識を楽に勉強させます。TopExamは君の試験への合格を期待しています。
Qlik Sense Business Analyst Certification Exam - June 2018 Release 認定 QSBA2018 試験問題:
1. A business analyst is creating a dashboard to analyze supply chains. The app must contain several elements
* A bar chart that shows a number of products and product groups handled by shipper
* A map that shows the number of shipments sent from factory locations
* A bar chart that shows average delivery costs by shipper
Which dimensions should the business analyst use for this app?
A) Shipper, Product
B) Product, Shipper. FactoryLocation
C) Shipper, Factor/Location
D) Product, ProductGroup. Shipper
2. A hospital billing department is concerned with the performance of the cardiology and orthopedic departments. The billing department wants to add a visualization to an existing app to analyze billing for these two departments.
The business analyst must consider the hierarchy of
* The department
* The physicians in each department
* The procedure performed by the physicians
What should the business analyst create to meet the requirements?
A) * A bar chart with a cyclic group
* A bookmark for the physician
B) * A bar chart using master items drill-down
* A bookmark for departments
C) * A scatter plot using set analysis
* A bookmark for departments
D) * A scatter plot using alternate dimensions
* A bookmark for the physician
3. A business analyst wants to develop a Qlik Sense app with some key performance indicators on the dashboard The analyst decides to use two KPI objects to represent key metrics for the organization.
Which two measures should the business analyst use to meet these requirements? (Select two.)
A) Margin by region
B) Number of customers
C) Number of products by customer
D) Number of customers by region
E) Number of products sold
4. A retailer with 300 locations worldwide needs to analyze its workforce to prepare for its next board meeting The two most important items to the board members are total compensation and number of employees by city.
Which visualization should a business analyst use to meet this requirement?
A) Pivot table
B) Map
C) Scatter plot
D) Bar chart
5. A wholesaler needs to show sales and products in a PowerPoint presentation. The dimensions and measures are:
* Product Name
* Sum of Sales
* Number of Orders
Which two chart types could the business analyst use to meet these requirements? (Select two.)
A) Combo chart
B) Scatter plot
C) Stacked bar chart
D) Treemap
E) Distribution plot
質問と回答:
質問 # 1
正解: A | 質問 # 2
正解: D | 質問 # 3
正解: D、E | 質問 # 4
正解: C | 質問 # 5
正解: A、C |


 PDF版 Demo


 品質保証TopExamは我々の専門家たちの努力によって、過去の試験のデータが分析されて、数年以来の研究を通して開発されて、多年の研究への整理で、的中率が高くて99%の通過率を保証することができます。
 一年間の無料アップデートTopExamは弊社の商品をご購入になったお客様に一年間の無料更新サービスを提供することができ、行き届いたアフターサービスを提供します。弊社は毎日更新の情況を検査していて、もし商品が更新されたら、お客様に最新版をお送りいたします。お客様はその一年でずっと最新版を持っているのを保証します。
 全額返金弊社の商品に自信を持っているから、失敗したら全額で返金することを保証します。弊社の商品でお客様は試験に合格できると信じていますとはいえ、不幸で試験に失敗する場合には、弊社はお客様の支払ったお金を全額で返金するのを承諾します。(
 ご購入の前の試用TopExamは無料なサンプルを提供します。弊社の商品に疑問を持っているなら、無料サンプルを体験することができます。このサンプルの利用を通して、お客様は弊社の商品に自信を持って、安心で試験を準備することができます。